Under the impact of the double whammy of global warming and the excessive artificialisation of our soil, cities are today experiencing difficulties in countering the increasingly problematic phenomenon of urban heat islands (UHIs).
This phenomenon of extreme overheating, which is a feature specific to the climate in cities as opposed to rural areas, is often amplified during particularly intense heat waves, such as in the summer of 2022. While UHIs are increasingly studied today, they are still difficult to characterise and assess in detail, due to the many parameters and factors involved: albedo (reflectivity) of surfaces, types of materials used in buildings and as ground surfaces, urban form and spatial organisation, the presence of water and vegetation, the impact of human activities in the city, etc.
Egis has embraced this major challenge faced by urban communities by developing the first reference tool to measure and study urban overheating. Based on the QGIS software package and published in open source, ICEtool is today a simple, fast and efficient method to comprehend urban overheating in all its complexity, to such an extent that it is beginning to become a prime tool for all urban planning stakeholders.
A wild gambit: what if UHIs became UCIs?
To gain an understanding of the urban heat island, complex microclimatic models can be used. These models are very precise, but remain expensive in terms of software and simulation time, which can make them unsuitable for the upstream phases of projects, precisely at the time when swift action must be taken, and when it is still possible to act alongside the designers. In practice, microclimatic modelling can take a full week to produce one day's worth of calculated results.
The goal of the studies carried out by our teams was thus to examine the heat islands in order to try to transform them into urban cool islands (UCI) as early as in the upstream phases of projects, in a concise and comprehensible manner.
Originally christened ICE in 2020, ICEtool is designed to meet the needs of those who "shape" the city, with the clear intention of sharing this tool, which can be implemented on QGIS, as widely as possible and making it open source.
This easy-to-use solution nevertheless retains a quantitative scientific approach, whereas other existing tools on the market tend to focus on qualitative criteria. ICEtool calculates the surface temperature of the ground in a given neighbourhood in order to quantify the urban heat island effect. In its latest version, it is fully integrated with QGIS and improves the calculation of the surface heat budget, now incorporating evapotranspiration, the temperature within the ground according to meteorological data, and the pavement materials in use, also drawing on a more extensive material database.
An array of reliable tools to measure urban overheating
Egis now has a growing range of tools based on commonly used, fast and efficient software such as QGIS. Their level of detail and scientific nature enable precise urban thermal calculations to be made using surface temperature data, along with comparative mapping between different project scenarios and the current situation.
These tools can be embedded in existing databases of GIS and open data programmes, and are intended to be "black box" free, open source, modifiable and editable.
With ICEtool, it is now possible to compare the current situation with future projects, quantify the impact of developments and target the critical points in the study area. This initial design aid approach provides essential information to reassure stakeholders on the quality of a future development, or to propose a more advanced study with microclimatic modelling.
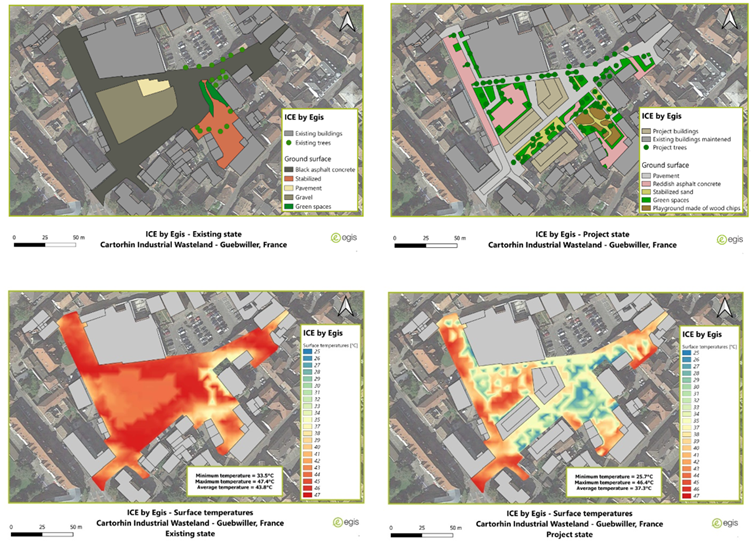
The software is now fully operational. Our teams have had the chance on several occasions to demonstrate its effectiveness on urban projects, such as the redevelopment of the Cartorhin brownfield site in Guebwiller, Alsace. This project, in the very centre of a small town of 11,000 inhabitants in the Alsace wine region, is located on a former industrial wasteland that was demolished before the start of our construction engineering mission. The main objective was to demineralise and plant the zone, and create a main corridor leading to the central Place de la République square. The use of ICEtool as a decision support tool led to an eco-designed project with more than a third of the space taken up with shrubs and a lot of trees. The urban heat island effect was built into this test project as the development progressed to demonstrate the improvement in thermal comfort for users. This equates to an average 6°C reduction in surface temperature , as illustrated in the renderings below, which also show the old maps from November 2021.

A precise thermal evaluation
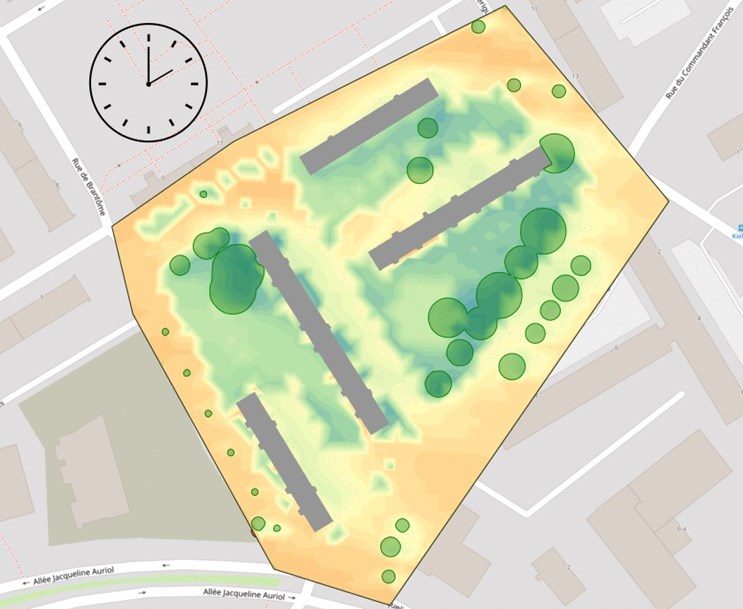
To determine urban overheating, we calculate the surface temperature of the ground in our project using a grid and an energy budget. This is an effective first indicator that simply allows us to compare two locations and measure, by extrapolation, the comfort of city residents.
We can choose a calculation period, the average of this period (often the day) or specific times. As a final indicator, we can give the temporal and spatial average of the surface temperature, as well as the maximum or minimum. As the tool is 100% digital, it is possible to modulate the indicators as much as desired according to the specificities of the projects.
To make it easier to use and allow the widest possible audience to carry out this type of study, we have combined the tool with the geographic information system (GIS) QGIS, which has the particularity of being open source. The other advantage is that with QGIS, our solutions are formally mathematical, and our maps can be customised as required.

A three-step method entirely conducted in QGIS
- Calculate the shadows cast by trees and buildings (over a day for quick calculation)
- Apply the ground surface materials from a database also provided in open source.
- Perform a ground surface energy budget calculation to obtain surface temperatures (the grid is created automatically) with an interpolation.
A large proportion of the basic information is accessible through open data (plans, building heights, etc.).
Making development choices easier
The tool helps us to make a reliable and scientific comparison of developments. It is not intended to replace advanced modelling, but rather to guide us towards the best choice of development. It is above all a decision-making aid.
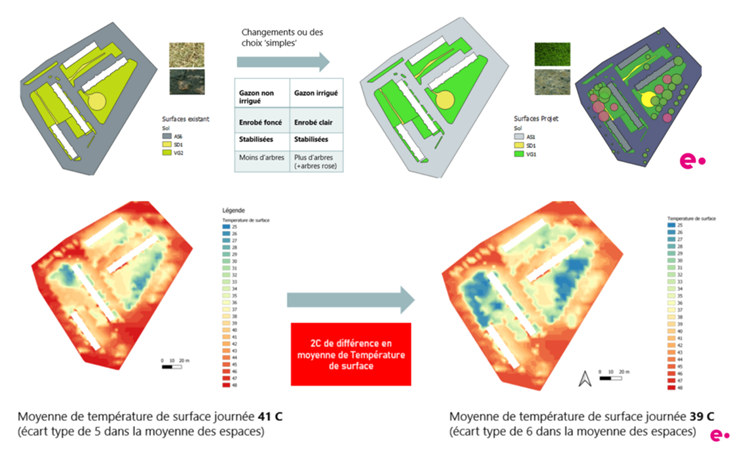
The illustration below shows some simple changes that can be made in an urban square: changing the type of asphalt, watering the grass more and changing it, planting more trees, etc. With these kinds of actions, it is possible to achieve a 2°C improvement in average daytime surface temperatures.

To model the materials comprehensively, we took into account thermal parameters such as albedo, emissivity, thermal conductivity, heat capacity and the evapotranspiration coefficient.
While developing the tool, the data had to be sourced and qualified so as to have the most reliable database possible. The data comes from scientific articles from reference works such as the Spectral Library of Impervious Urban Materials and the Lawrence Berkeley National Laboratory, as well as from others such as MatWeb to complete certain data. As the database is also free, it can of course be upgraded by adding particular materials for which thermal data is known.
Open source
With this tool, our teams expressed the desire to offer a form of open source environmental engineering to allow all players in the building and urban development world to have their say in the design of urban spaces and buildings that combine comfort of use and a lower environmental footprint.
This solution is upgradeable and has built in new feedback on actual use cases. While further software developments are still under study, it is already perfectly usable in its current state to study urban-level climate issues.
